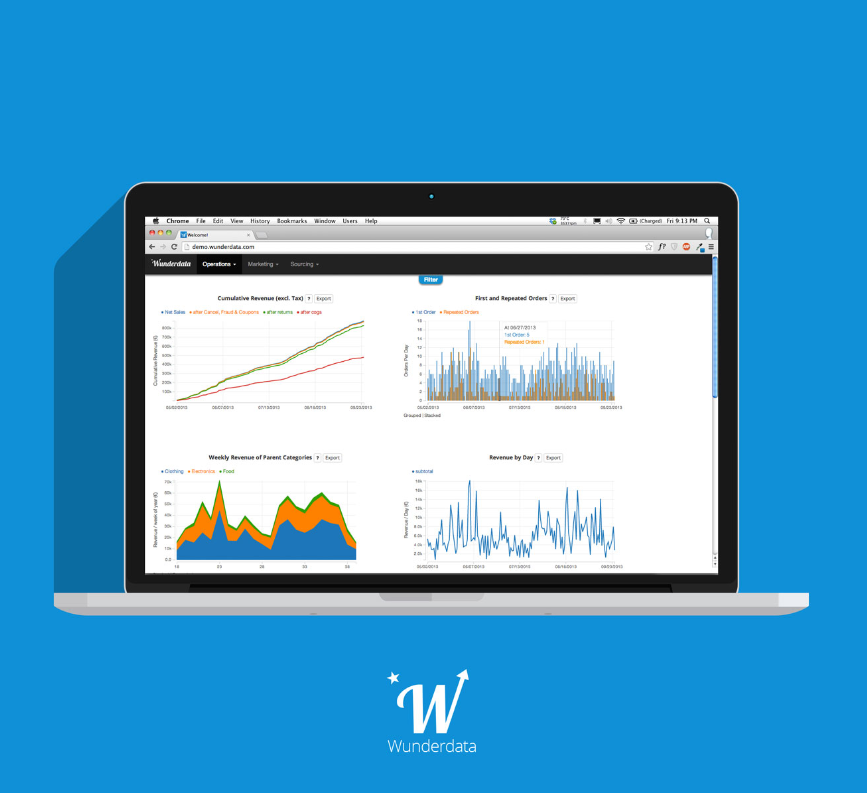
Visual Business Intelligence
The amount of data generated by online shops multiplies tremendously as customers and orders grow. Most of the time this data is left to pile up in databases, because intuitive business intelligence tools are missing.
Power to the business user
Wunderdata is focusing on the needs of online shops and those who run them. Based on the best practices in eCommerce, we created dashboards which give every employee access to big data analytics. No specific knowledge required.
Always ready for the show
We don’t deliver flat reports, but dashboards that can be interacted with through our global filter. These dashboards can be presented directly to the team without the need to build reports or powerpoint presentations.
Beautiful and clear
Complex doesn’t have to be complicated. Intuitive visualizations speak clearer than words.

Visual business intelligence by Wunderdata

- Out-of-the box KPI dashboards based on eCommerce best practices
- Complex data displayed in a visually compelling way
- All reports are interactive and can be sorted, filtered, drilled, sliced and diced with one click
- No programming or database knowledge required
- No hardware requirements: a browser is sufficient to use the software
- Less than 1h effort to complete the installation process
- APIs for the most popular business applications
- No setup fees
