Optimize your product range
Having the right products in the shop is crucial in maintaining low costs and high profits.
Wunderdata customers can answer these questions instantly.
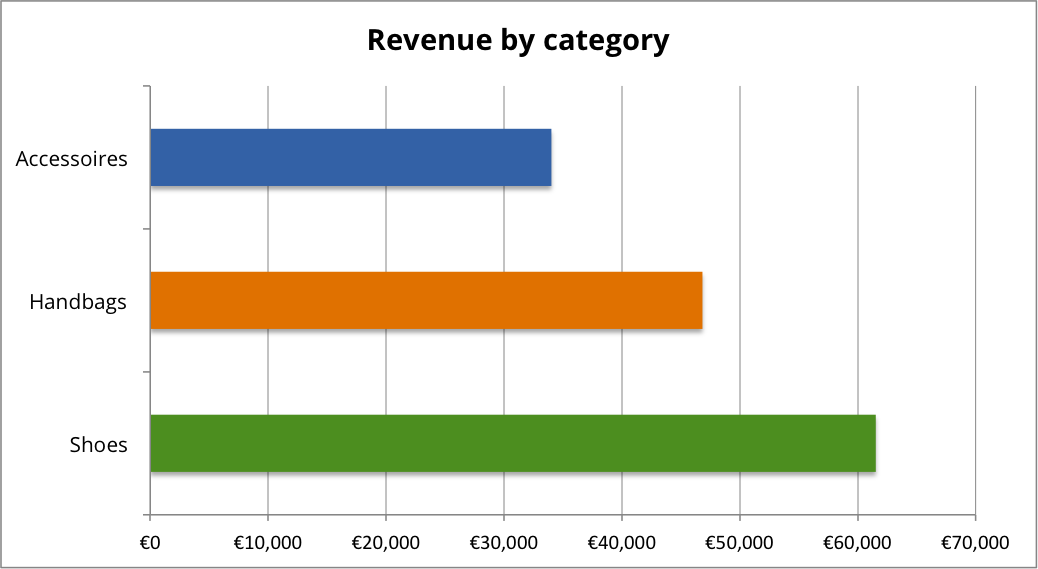
First we get a top level overview of how the categories performed. If we examine the chart on the right, we can see that the shoe category brings the most revenue into the shop.


Let’s dig deeper and check out the contribution margins of each category. We see that shoes do sell well, but their contribution margin is low because of high return rates. Accessories instead appear to be the most profitable category
What to do next? With this insight we can do several things:
- Adjust acquisition channels to promote your best selling accessories.
- Create targeted email newsletter campaigns to encourage the purchase of accessories.
- Widen your product offer to expand the accessories category.
So what about the shoe category? As we drill deeper and look at the return rates on a product level, we see that a specific brand is responsible for extraordinary high return rates. Maybe the product description, pictures or sizes don’t accurately reflect the product? Try tweaking those parameters or consider removing the brand. The contribution margins should normalize for the whole category.

